![]()
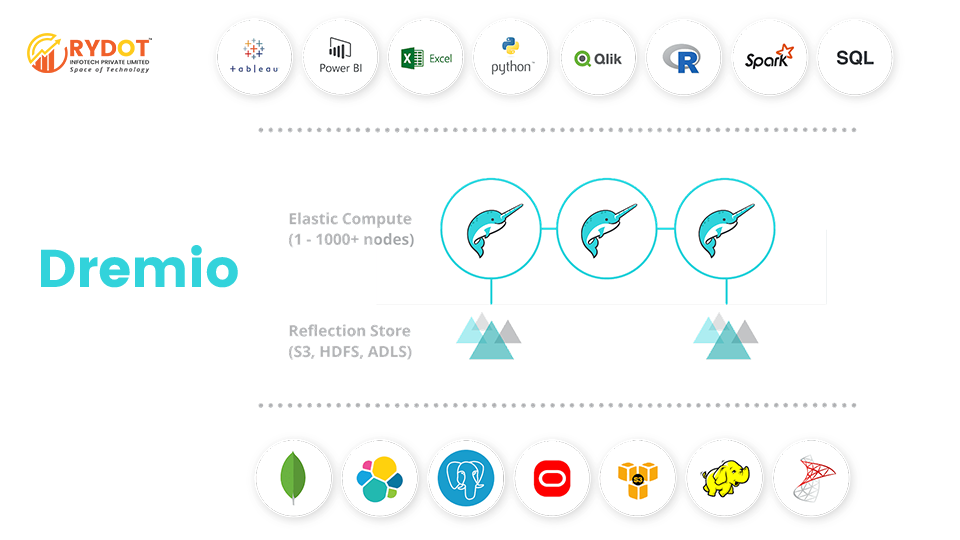
Companies create data in a wide range of technologies, including relational databases, SaaS applications, NoSQL, Amazon S3, Hadoop, and other systems. In order to make sense of all this data, companies use BI tools like Tableau, Power BI, and Qlik, or data science products like Python and R. To make data from all the different sources available to all these analytical technologies, companies build data warehouses, data marts, and data lakes, and they move data with ETL, custom scripts, or data prep tools. With this approach, companies build enormous complexity and cost around their data. They also create an environment where business users are entirely dependent on IT.
Dremio is built to help analysts, data scientists, and data engineers be more effective with data. Dremio is different from traditional approaches to data analytics because it combines:
Self-Service Experience: Dremio is designed so that consumers of data can be independent and self-sufficient so they aren’t dependent on IT. With Dremio it’s easy to discover, curate, share, and accelerate data.
Integrations to Popular Tools: Analysts, data scientists, and data engineers are most effective using tools they already know and love, so we built Dremio to integrate with products like Tableau, Power BI, and Qlik, as well as Python and R. Dremio makes these tools even better.
Native Query Push-Downs: Dremio, thinks the world would be a better place without ETL and data warehouses, so we designed Dremio to push queries down into any source, using highly optimized integrations, even when the source doesn’t support SQL.
Data Acceleration: Making data fast is essential for analytics and data science, so Dremio built an innovative data acceleration capability that automatically optimizes your data and your queries using Apache Arrow.
Data Lineage: Dremio understands that data flows through pipelines and analytical processes, and this is very difficult to track across different users and different technologies. Dremio, makes understanding and tracking data lineage a key feature that’s easy for anyone to use.
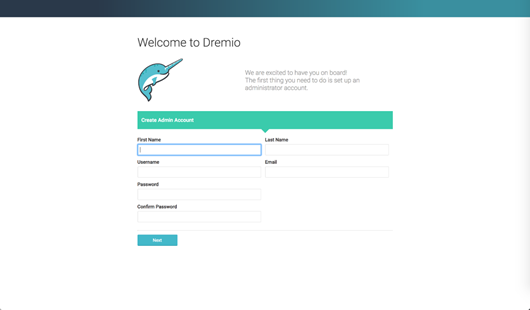
Accessing Dremio
If you are the first person accessing Dremio, you’ll be asked to create an administrator account:
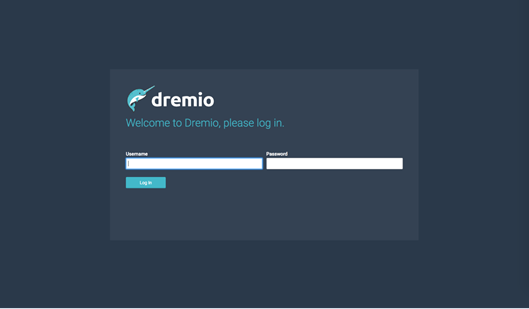
Once the admin user is set up, users will be asked to log into Dremio:
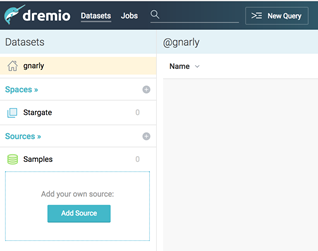
Once you’re authenticated, you will see the home screen. If this is a new installation, it will look pretty empty:
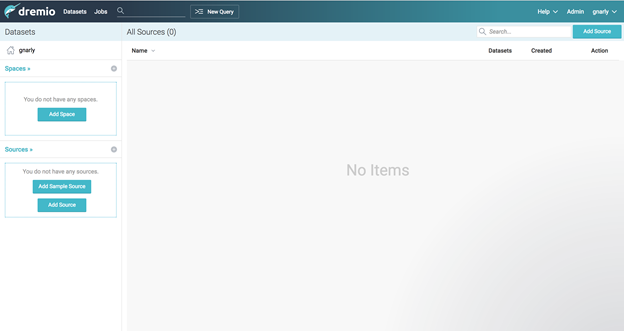
Sources
Let’s take a look around and start with the bottom left, Sources:
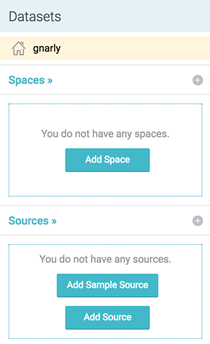
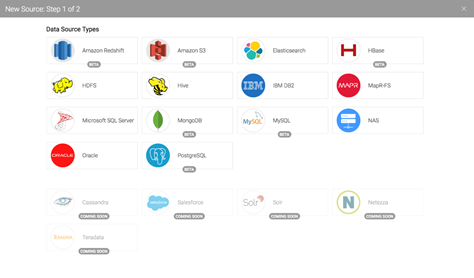
Sources are systems where data is managed in your company. Dremio connects to these sources to access datasets. If you already have a source in mind, that’s great! You can click on the New Source button at any time. You’ll see a dialog that will let you set up different kinds of sources, including relational databases, NoSQL, and distributed file systems:
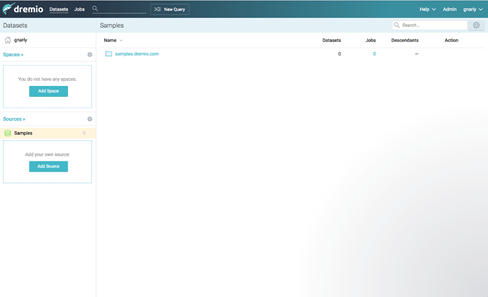
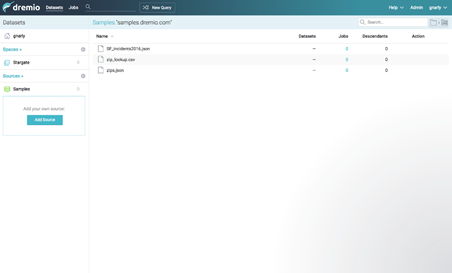
For this tutorial we’re going to use a sample dataset stored on Amazon S3 that’s easy to connect to. Simply click the Add Sample Source button. You should now see a Samples source listed under your sources, and a samples.drmeio.com bucket listed as a folder on the right side of the screen:
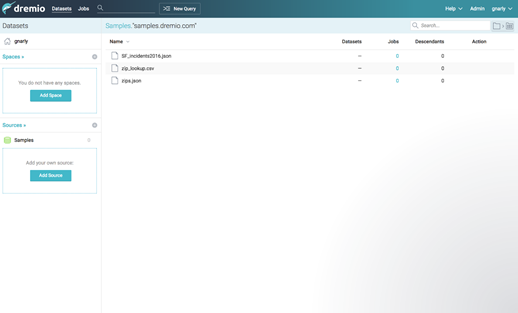
If you double click on samples.dremio.com, you’ll see the public files we’ll use in our next tutorial:
Spaces
Next, let’s create a space. Spaces allow users to collaborate around virtual datasets. You might create a space for a project, or for a team or department. Let’s create a space called “Stargate.” Click on the “New Space” button on the left side of the screen:
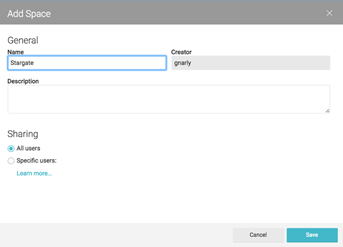
By default, new spaces are public and visible by everyone. You can also configure which users have access to a space, either now or after the space is created. Let’s leave this space public.
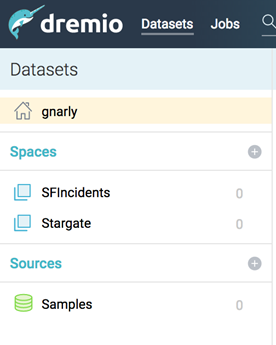
Click Save to finish creating the ‘Stargate’ space. The screen should now show Stargate as a space:
At the moment there’s nothing in this space. Users can save their virtual datasets in spaces they have “Can Edit” access to. We’ll take a closer look at these abilities in our next tutorial.
Home Space
Now, just above our spaces, we can see our user name next to a home icon.
This is your home space. If you want to upload a file from your desktop, such as an Excel spreadsheet, it will be stored in your home space and will not be visible to other users. Datasets in your home space are like any other dataset in Dremio – they can be queried, joined to other datasets, analyzed with BI tools or Python, and so on.
Other Controls
Now let’s take a closer look at the bar on the top left of the screen:

- Datasets include Sources, Spaces, and your home space, as we’ve just reviewed.
- Jobs are units of work processed by Dremio. For example, when a user issues a query to a dataset, this request is processed as a job. For each job Dremio tracks details such as who issued the request, metadata about the results, any errors, and other useful information. We haven’t set up any datasets, so there are no jobs in the system yet.
- Search allows you to quickly find datasets. As you connect data sources, Dremio indexes metadata like the names of tables, columns, and fields. This makes it easy to find a dataset across all of your different sources and spaces.
- New Query opens Dremio’s query editor. You can write full SQL against any of the datasets in Dremio and see results.
To wrap things up, let’s take a look at the buttons on the upper right:

- The Chat Icon gives you access to Dremio’s engineers directly. If you have a question about Dremio, let’s talk! (note, this feature is limited to users of Dremio Enterprise Edition)
- Help gives you access to the Dremio’s Community, documentation, and other resources.
- Admin gives you access to Dremio’s administration menus.
- Your name gives you access to your profile.
Working with Your First Dataset
Intro
In this tutorial we’ll work with a sample dataset to give you a sense for the ways Dremio makes it easy to work with data. While Dremio is built to make working with very large datasets fast for analytical processing, in this tutorial we will work with a small dataset to help you get started. We’ll use a single year of incidents as reported by the San Francisco Police Department. This is a JSON file of around 150,000 records.
The Data
Dremio supports most data sources and many file formats. In this tutorial we will be working with data provided by the city and county of San Francisco.
| Field | Type | Example |
| IncidentNum | String | 170512983 |
| Category | String | VEHICLE THEFT |
| Descript | String | STOLEN AUTOMOBILE |
| DayofWeek | String | Saturday |
| Date | String | 06/24/2017 |
| Time | String | 00:30 |
| PdDistrict | String | SOUTHERN |
| Resolution | String | NONE |
| Address | String | 9TH ST / MISSION ST |
| X | String | -122.414714295579 |
| Y | String | 37.7762310404758 |
| Location | String | (37.7762310404758°, -122.414714295579°) |
| PdId | Integer | 17051298307021 |
Accessing the Data With Dremio
Let’s start by creating a new space. Click on the plus sign next to Spaces and add a space called “SFIncidents”:
We’ll use this space to work with our virtual datasets. Next, let’s start to work with the Police incidents data stored on S3. Navigate to Samples in the Sources section on the bottom left, then samples.dremio.com:
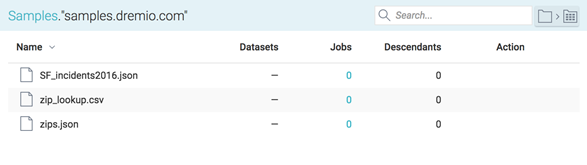
The white file icon next to each file indicates that Dremio knows this is a file, but it doesn’t yet know its format. Throughout this series of tutorials we’ll be working with a single year of incidents (SF_Incidents2016.json) that includes about 150,000 records. The city provides many years of history in case you’d like to work with a larger dataset later.
To identify the format, hover over the file and to the right you’ll see a folder icon with an arrow pointing to another folder with a grid:
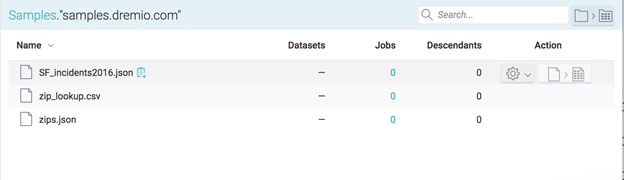
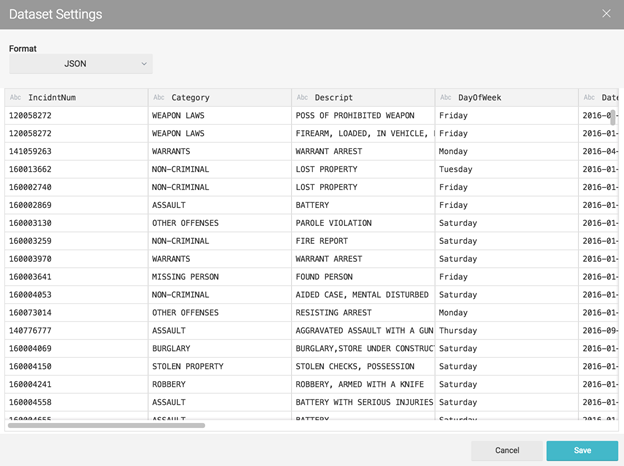
Once you click on this icon, you’ll see a sample of the data and a dialog to confirm the format:

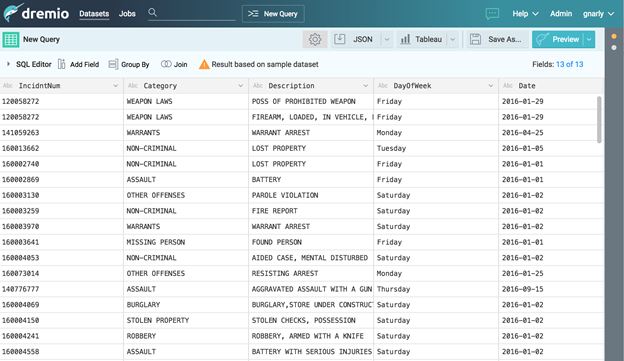
Dremio supports many types of files, including Excel, JSON, Parquet, and others. With some file formats there are configurations to make (eg, field delimiter, line delimiter), but because JSON is self-describing we can simply click “Save” and now you’ll see a sample of the data presented in Dremio’s dataset viewer:
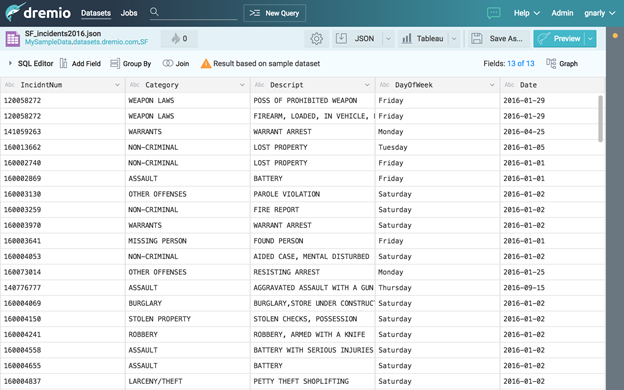
There’s a lot going on in this screen, so let’s go over a few things.
Understanding the Dataset Viewer
You’ll see a purple dataset icon in the upper left, followed by the full name of the dataset – Samples.”samples.dremio.com”.”SF_incidents2016.json” – which follows Dremio’s hierarchical namespace model: .[space name].[dataset name].
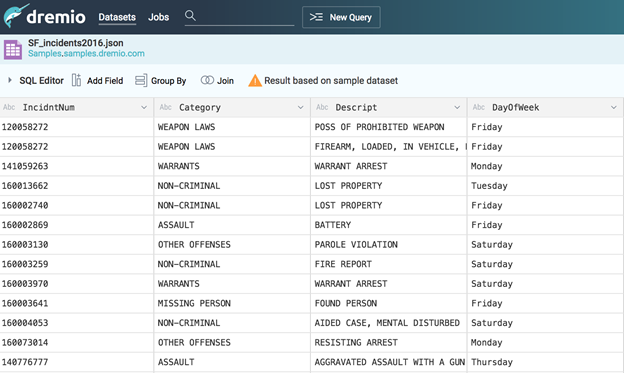
The purple icon means that Dremio understands this is a physical dataset. It also means that we can now query this dataset using SQL from any tool. For example:
SELECT *
FROM Samples.”samples.dremio.com”.”SF_incidents2016.json”
Building Your First Virtual Dataset
Click on the word “Descript” on the top of the third column. You should now be able to edit the column by simply typing “Description” and clicking return. Now the name of this column will be “Description” for all queries. Note that this made no changes to the source data.
Next, the column called “Date” is actually a string, so let’s change the Date column from a string to a date. On the left side of the column header click on the “Abc” icon to open the data type menu:
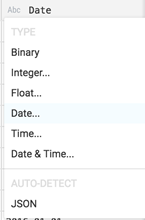
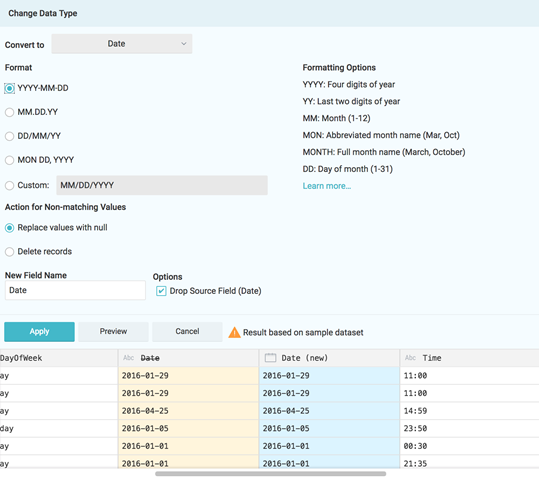
Click on “Date…” and you’ll now see a screen with lots of options to help you convert this string to a date. From the list of formats, the first option works for this column. Below, you can see a preview of the data with the original in yellow and the converted column in blue:
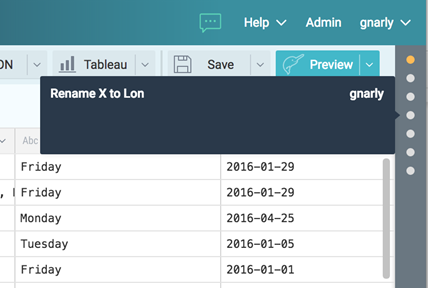
There are a few more changes to make with this dataset. Change the types of the X and Y columns to Float, and rename them to Lon and Lat respectively. After applying these changes your virtual dataset should look like this:
Notice along the upper right a series of grey dots with a yellow dot on the top.
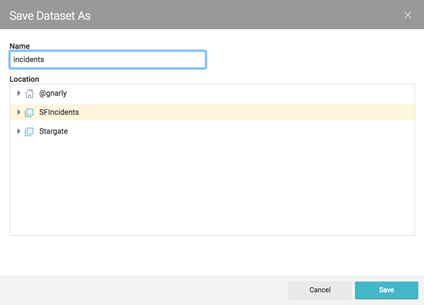
Now let’s save our virtual dataset. Click “Save As…” and you’ll see a list of spaces. Select “SFIncidents” and call this virtual dataset “incidents.”
Now the upper left shows a green dataset icon, and the full name of this virtual dataset is “SFIncidents.incidents”:
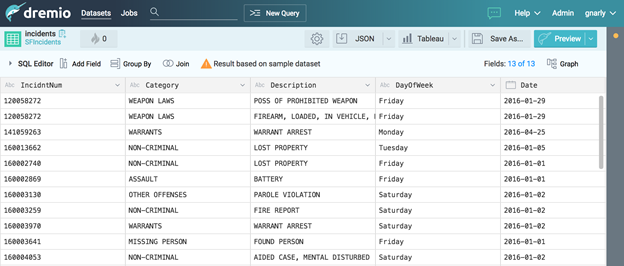
Now we’ve successfully created our first virtual dataset, “SFIncidents.incidents.” Without making a copy of the source data, and without writing any SQL, we’ve changed the names of some of the columns and changed some of the data types to suit our own needs.
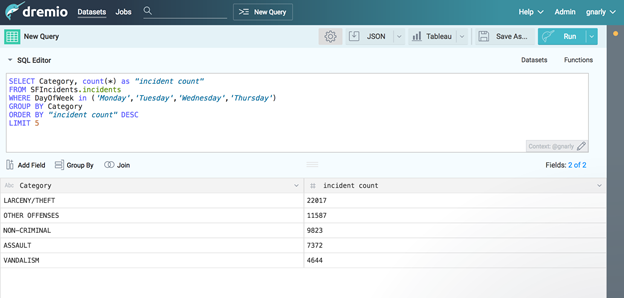
This virtual dataset is a first class relational object. You can query it with SQL, join it to other physical or virtual datasets, perform aggregations, and so on. For example, you can now click the New Query button at the top and query this virtual dataset with SQL:
SELECT Category, count(*) as "incident count"
FROM SFIncidents.incidents
WHERE DayOfWeek in ('Monday','Tuesday','Wednesday','Thursday')
GROUP BY Category
ORDER BY "incident count" DESC
LIMIT 5
This query asks for the top 5 most frequent incidents that occur during weekdays. You should see the following results (be sure to click Run instead of Preview):
Conclusion
Dremio is a tool capable of unifying existing repositories of unstructured data. In this tutorial we worked with JSON files in Amazon S3. In just a few minutes we were able to connect Dremio to a public file and issue a SQL query, all without making a copy of the data, and all without writing any code. We explored the ideas of physical and virtual datasets, which allow users to customize the data they need for their own analytical jobs, without asking IT to first make a copy.